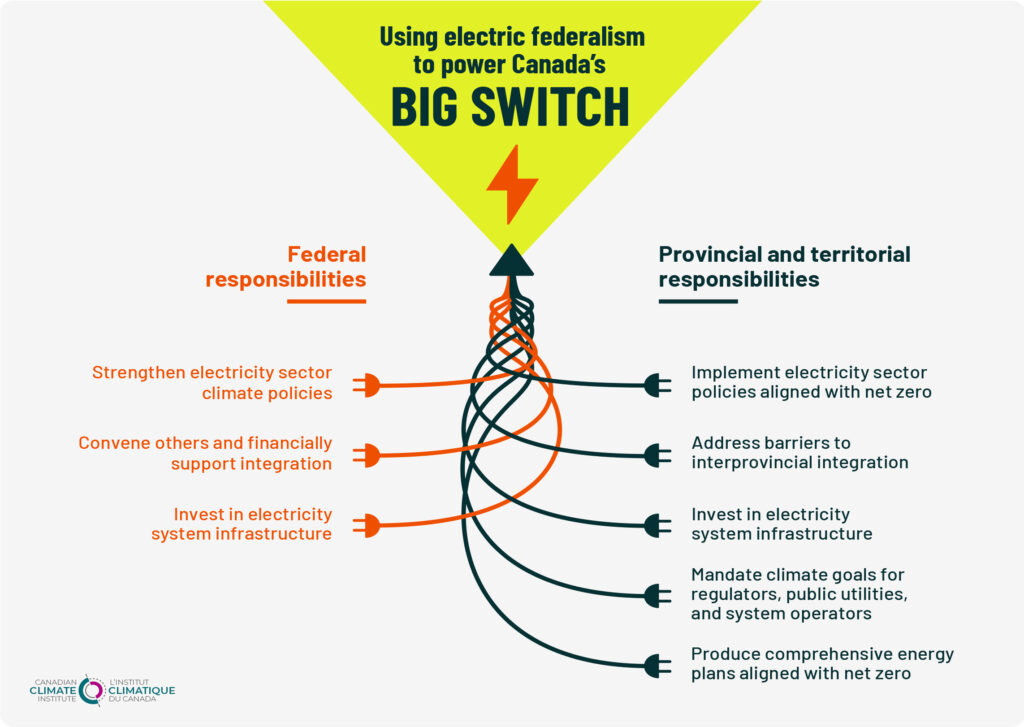
Data visualizations
See our summary report for context. All text and graphs are Creative Commons licensed and free to use with attribution.
Province- and territory-level breakouts are also available.
Figure A.
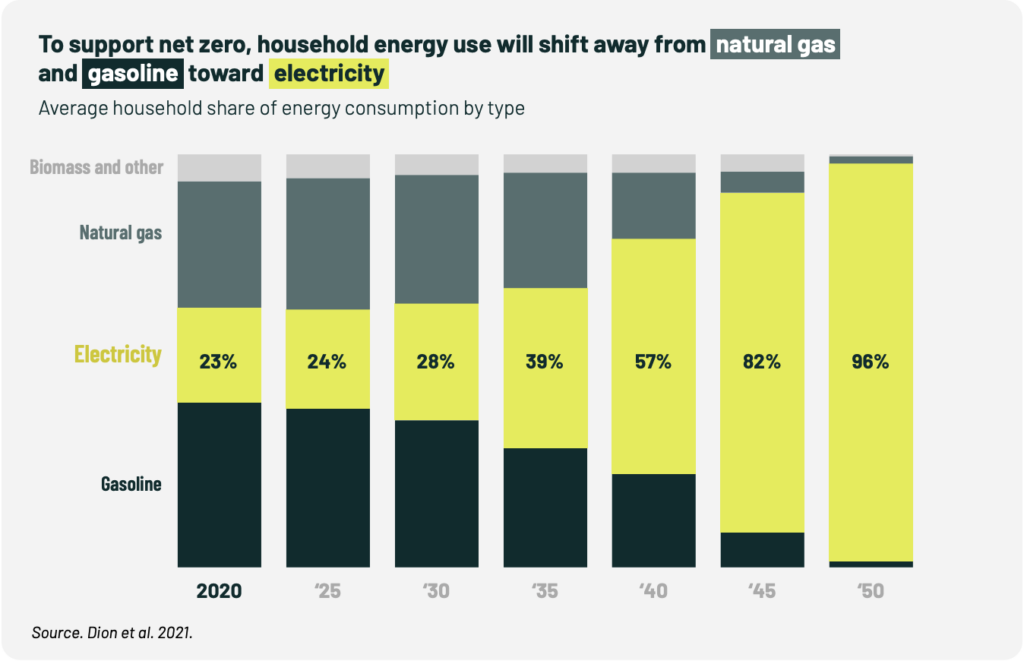
Source: Dion et al. 2021.
Figure B.
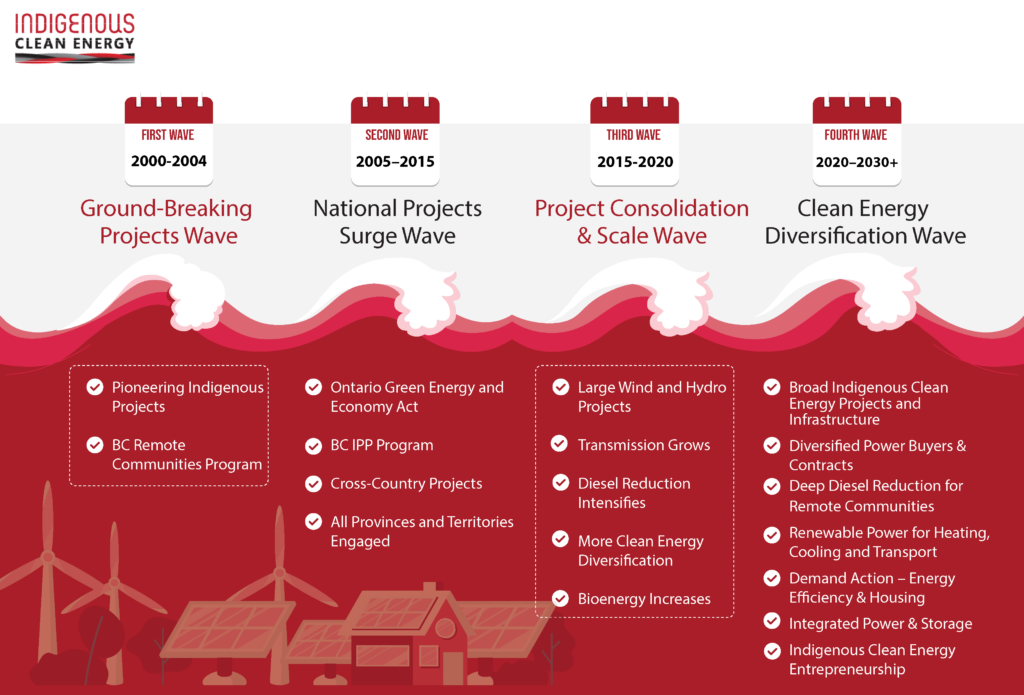
Source: ICE 2022.
Figure C.
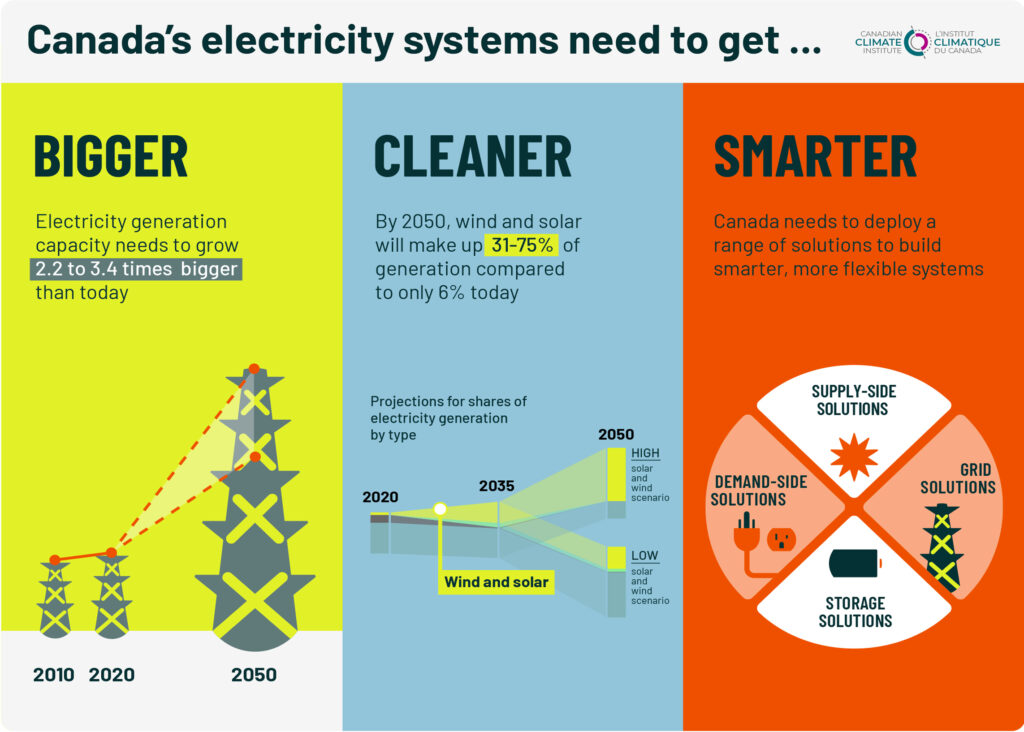
Figure D.
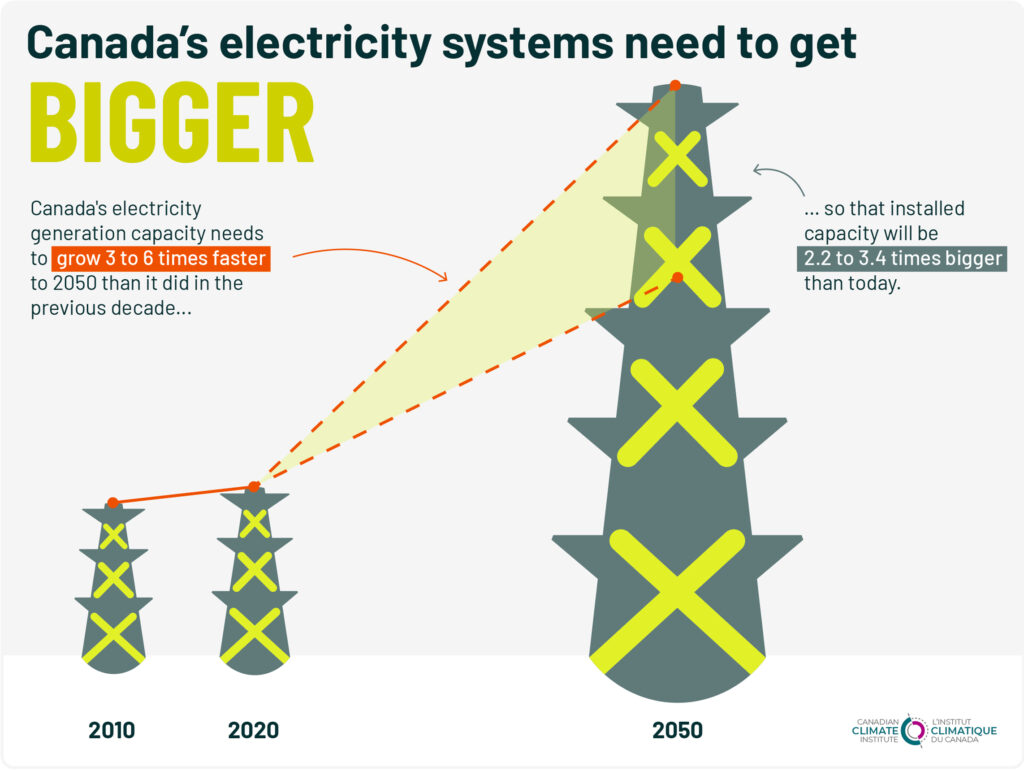
Figure E.
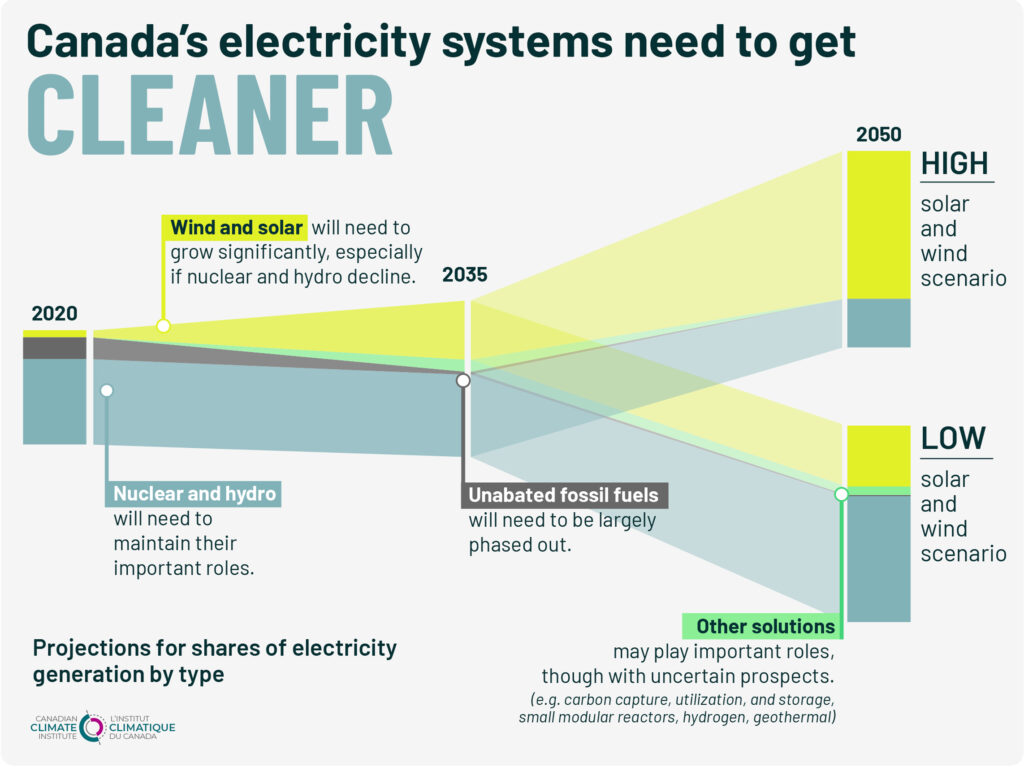
Figure F.
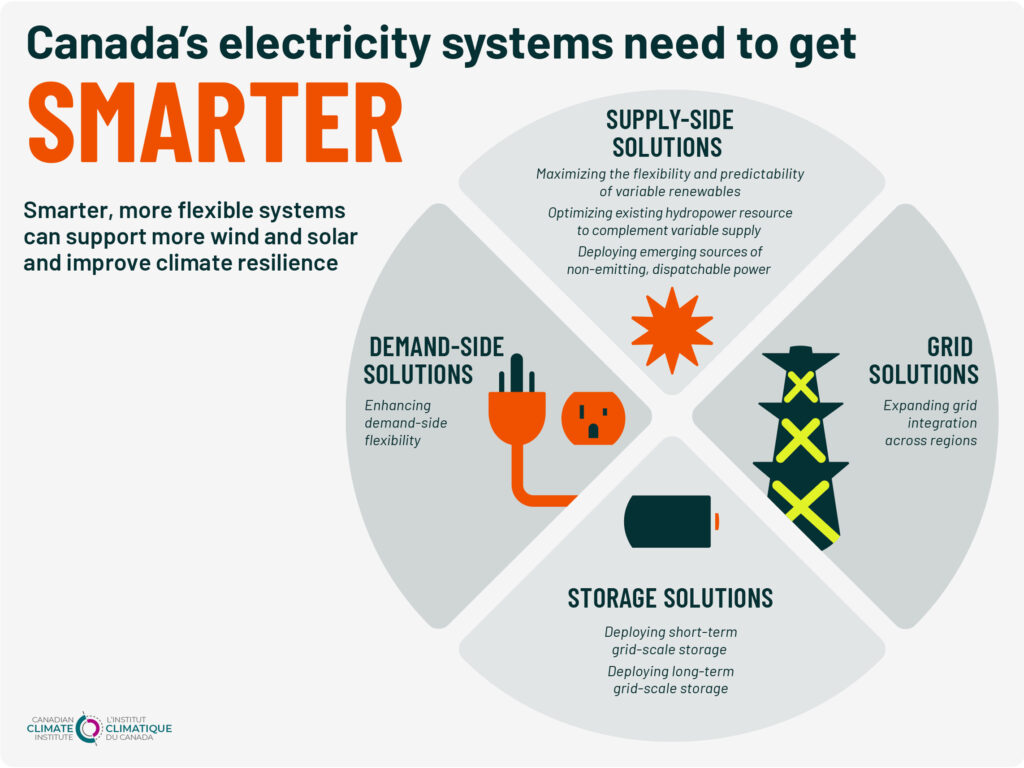
Figure G.
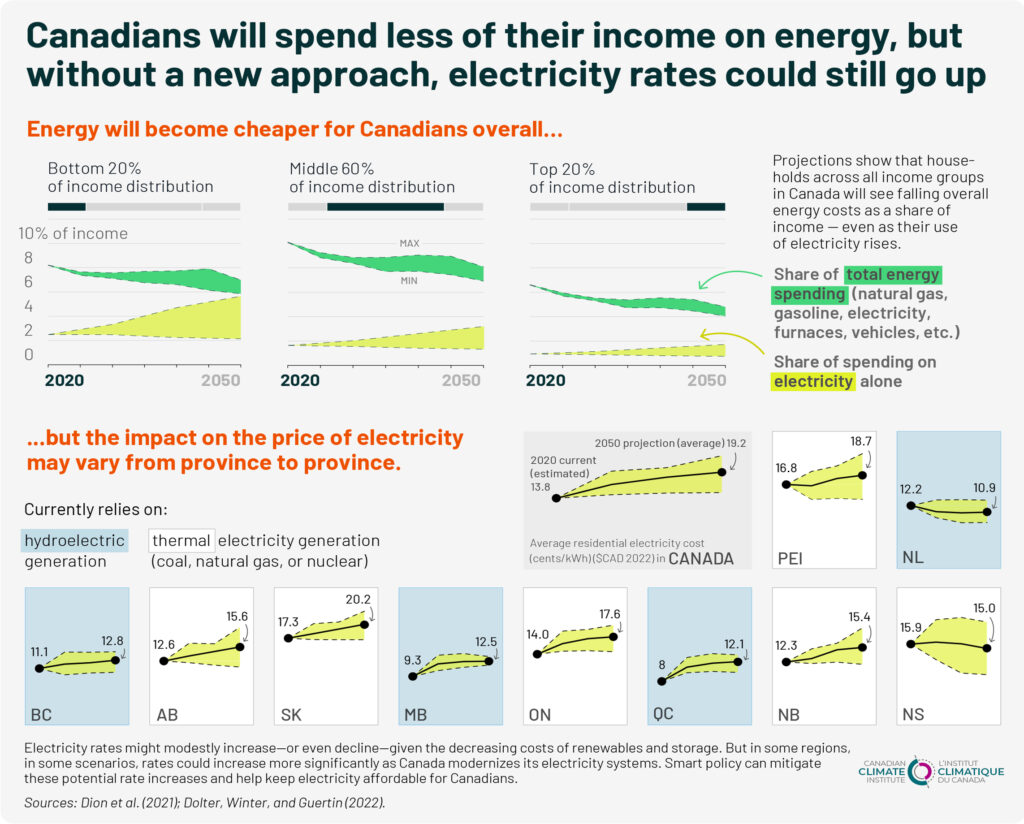
Figure H.
