Resources

Presentation

The research team go through the main findings and recommandations of Due North:

Access the briefing deck here.

Infographics

All Due North text and graphs are Creative Commons licensed and free to use with attribution.

Figure 1
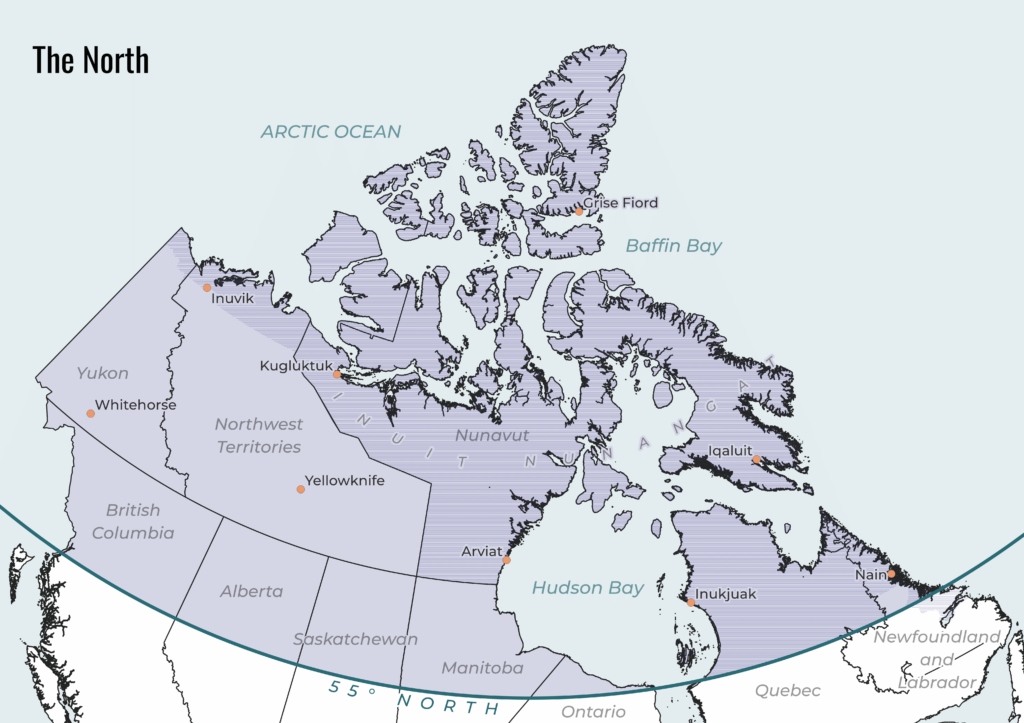
Map of the North, showing the Canadian regions studied in our report and highlighting the main cities: Whitehorse, Inuvik, Kuglutuk, Yellowknife, Arviat, Inukjuak, Grise Fiord, Iqalut and Nain.
Click to enlarge

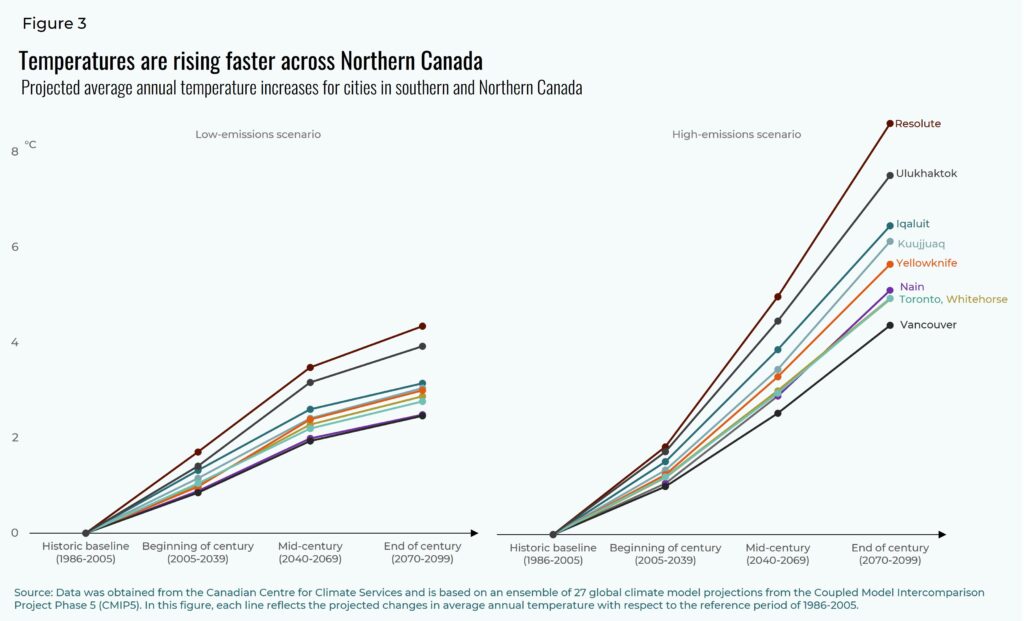
Figure 3

Temperatures are rising faster across Northern Canada. Projected average annual temperature increases for cities in southern and Northern Canada. Low-emissions scenario and high-emissions scenario.
Click to enlarge

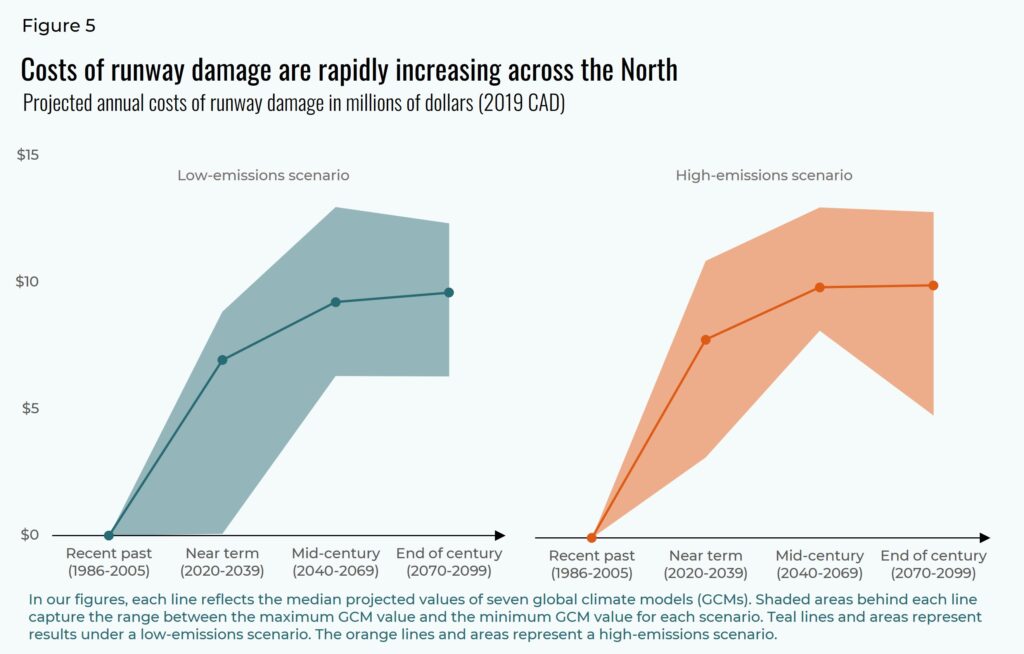
Figure 5

Costs of runway damage are rapidly increasing across the North. Projected annual costs of runway damage in millions of dollars. Low-emissions scenario and high-emissions scenario. Each line reflects the median projected values of seven global climate models.
Click to enlarge

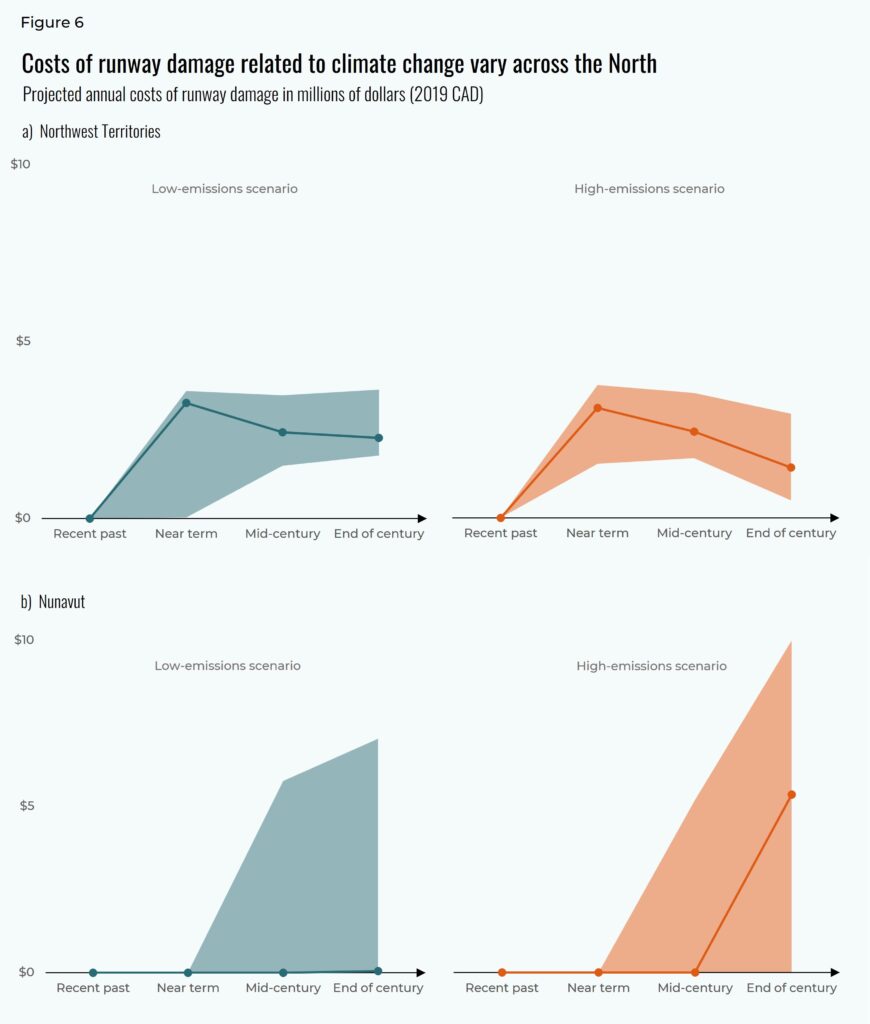
Figure 6

Costs of runway damage related to climate change vary across the North. Projected annual costs of runway damage in millions of dollars, in the Northwest Territories and Nunavut. Low emissions scenario and high-emissions scenario.
Click to enlarge

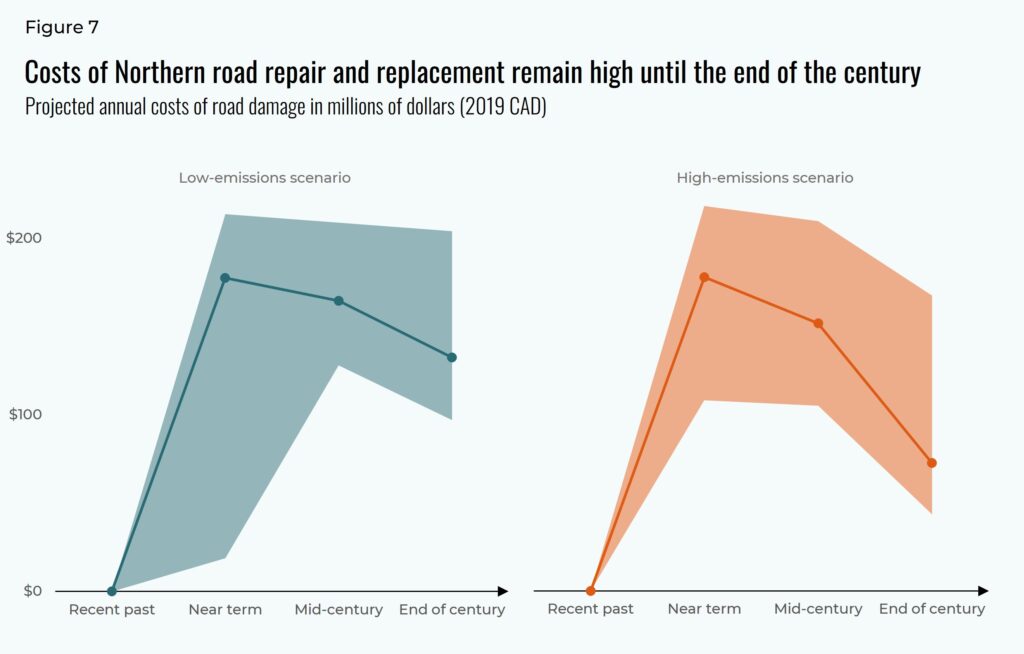
Figure 7

Costs of Northern road repair and replacement remain high until the end of the century. Projected annual costs of road damage in millions of dollars. Low-emissions scenario and high-emissions scenario.
Click to enlarge

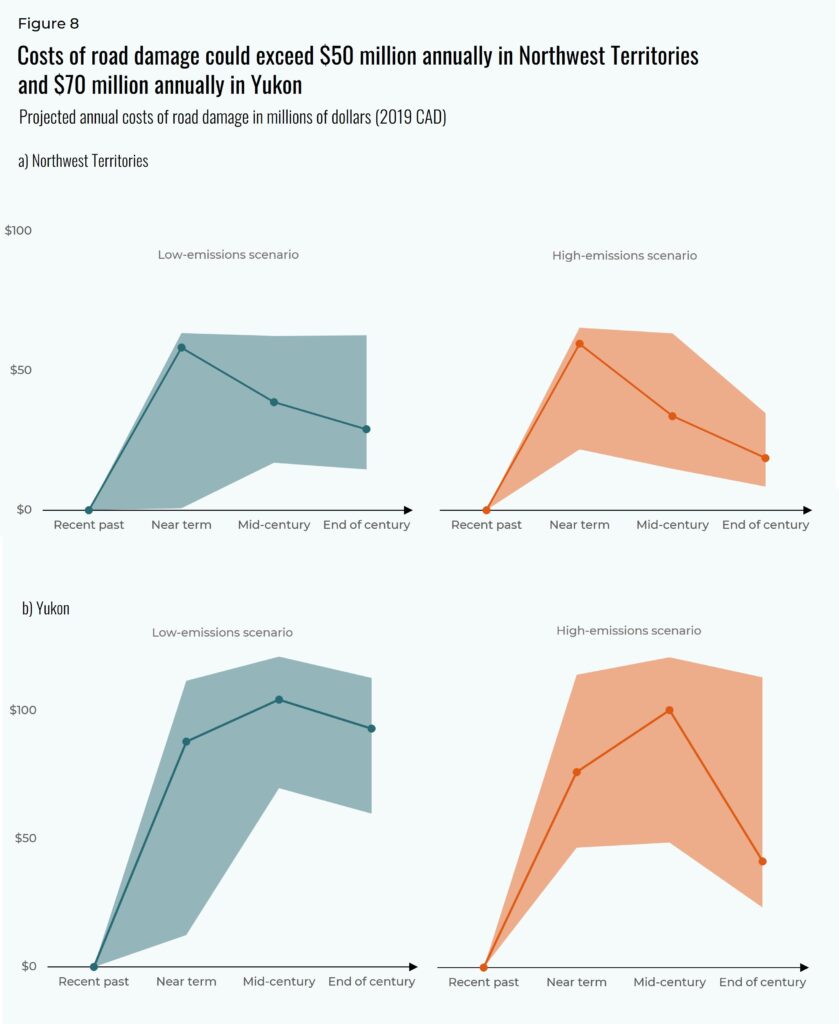
Figure 8

Costs of road damage could exceed $50 million annually in Northwest Territories and $70 million annually in Yukon. Projected annual costs of road damage in millions of dollars, in the Northwest Territories and Yukon.
Click to enlarge

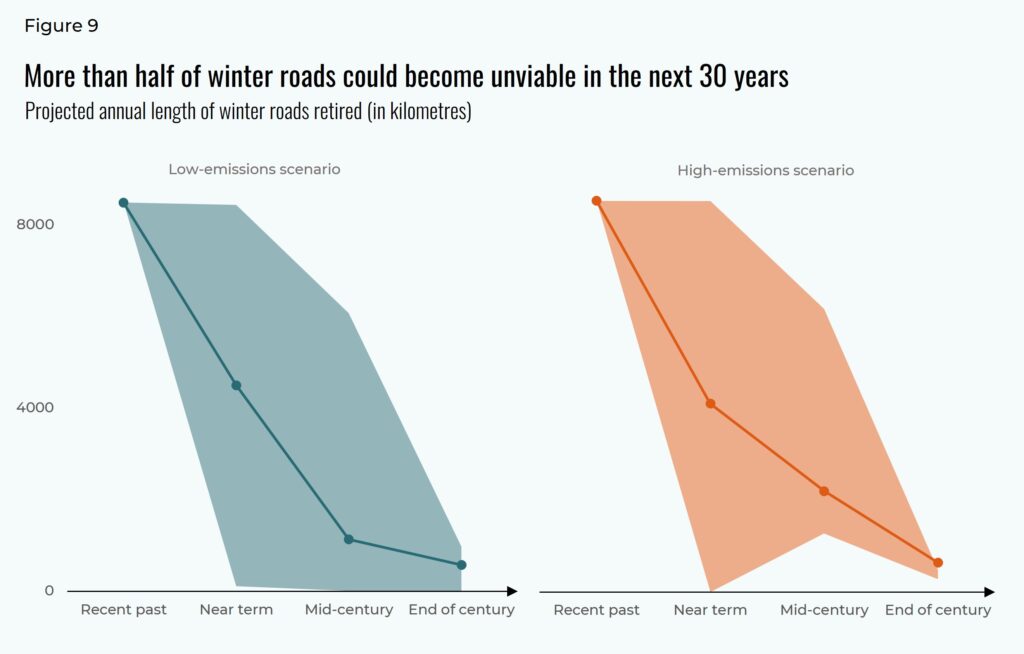
Figure 9

More than half of winter roads could become unviable in the next 30 years. Projected annual lenght of winter roads retired (in kilometres). Low-emissions scenario and high-emissions scenario.
Click to enlarge

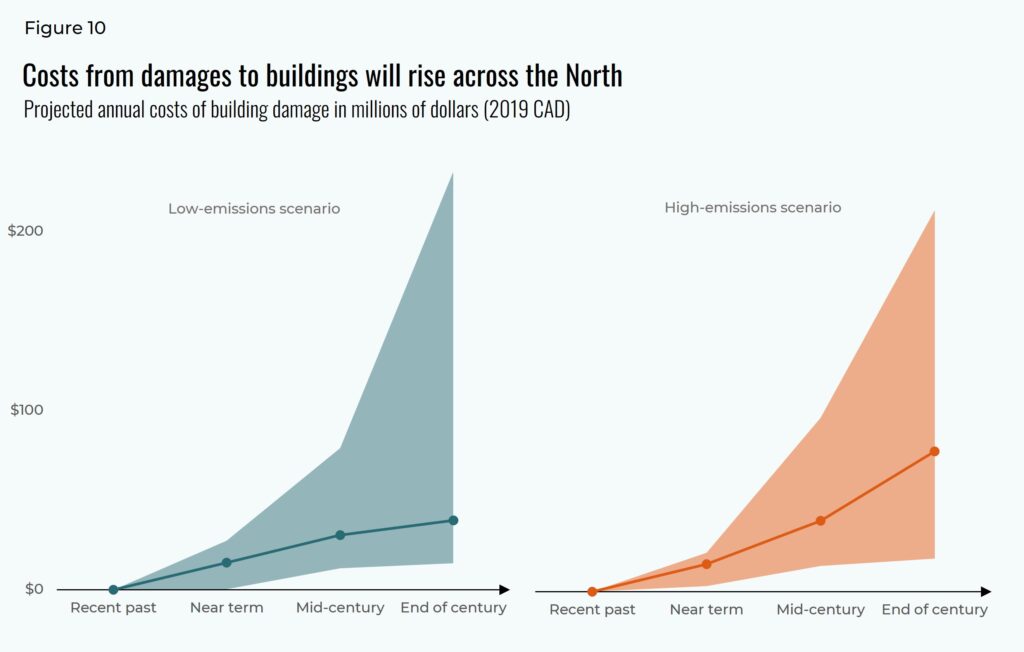
Figure 10

Costs from damages to buildings will rise across the North. Projected annual costs of building damage in millions of dollar. Low-emissions scenario and high-emissions scenario.
Click to enlarge

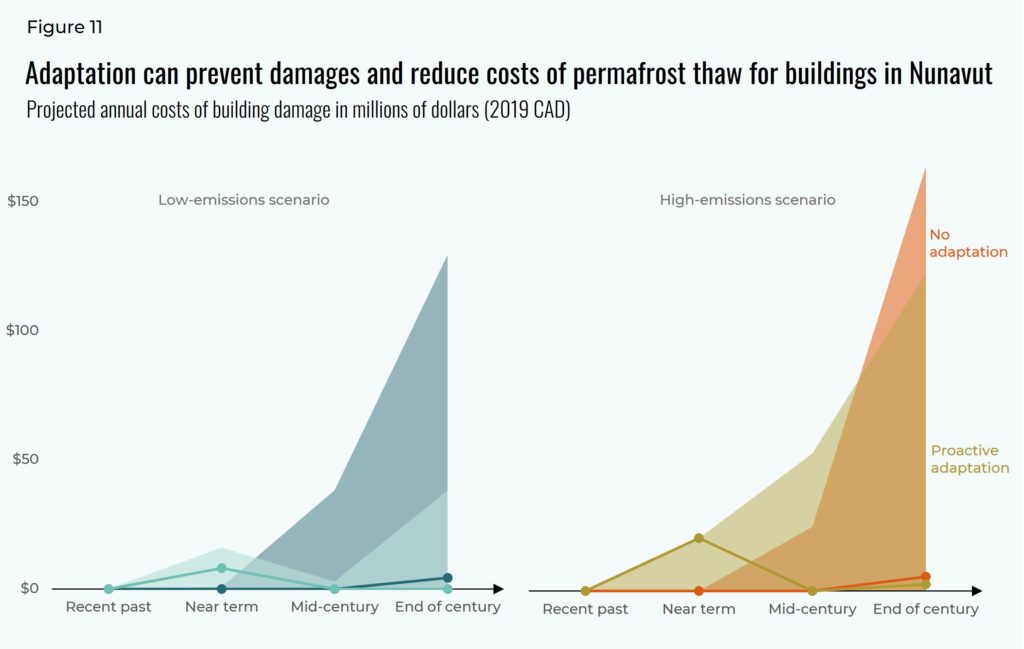
Figure 11

Adaptation can prevent damages and reduce costs of permafrost thaw for buildings in Nunavut. Projected annual costs of building damage in millions of dollars. Low-emissions scenario and high-emissions scenario.
Click to enlarge

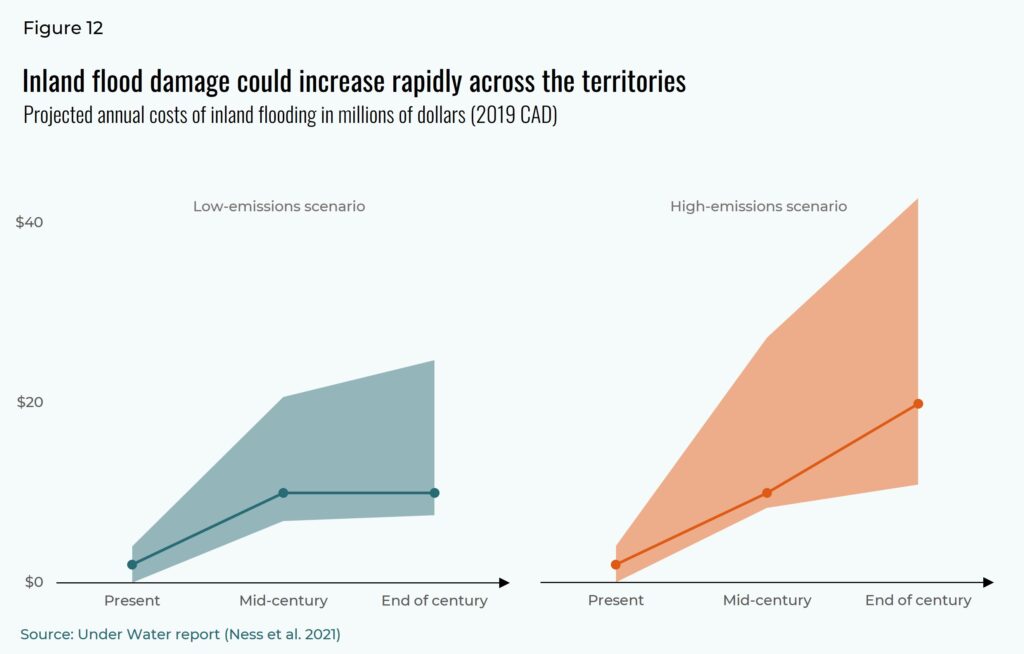
figure 12

Inland flood damage could increase rapidly across the territories. Projected annual costs of inland flooding in millions of dollars. Low-emissions scenario and high-emissions scenario.
Click to enlarge