This blog is a companion piece to our report, 11 Ways to Measure Clean Growth.
COVID-19 and the global anti-racism movement have a lot to teach us, including how human well-being, equity, and inclusivity need to play a much bigger role in how we make decisions as a society. We’re seeing how connected Canada’s social fabric really is, and also where it’s frayed. Those most affected by COVID-19 are disproportionately Indigenous, low-income, racialized, and marginalized.
The same is true of who bears the brunt of the impacts of climate change in Canada.
Together, these events are pushing governments to rethink what sound policy looks like. More and more evidence suggests that effective and durable policy requires a strong foundation of social and political trust—confidence that governments can solve big challenges and make Canadians better off. Policies that ignore or fail to address systemic racism and high rates of inequality and poverty, for example, can erode this foundation and fall apart over time.
Building from the bottom up
Climate policy in Canada should be no different.
The Institute’s new report on clean growth recognizes upfront that success on climate change hinges on our health and well-being, and that we cannot claim success if some people get left behind. More specifically, climate policies won’t last if they exacerbate existing inequities in our society: for instance, by raising the cost of living for those already struggling to make ends meet or by helping affluent property owners adjust to climate impacts while ignoring the needs of those living with housing insecurity. Success requires we identify vulnerabilities and, where possible, directly address them through smarter, fairer, and more inclusive climate policy.
The report uses a set of 11 indicators to measure and track Canada’s progress on clean growth. Four of these indicators focus specifically on building a stronger social foundation for addressing climate change and improving economic prosperity. They offer a wide spectrum, from ensuring that people have access to employment opportunities in a low-carbon economy, access to affordable energy, resilience against a changing climate, and clean air to breathe.
Together, these four indicators represent the social and economic foundation of clean growth. We can’t achieve clean growth without them. (A separate blog on the fifth foundation indicator, Thriving Ecosystems, will come soon).
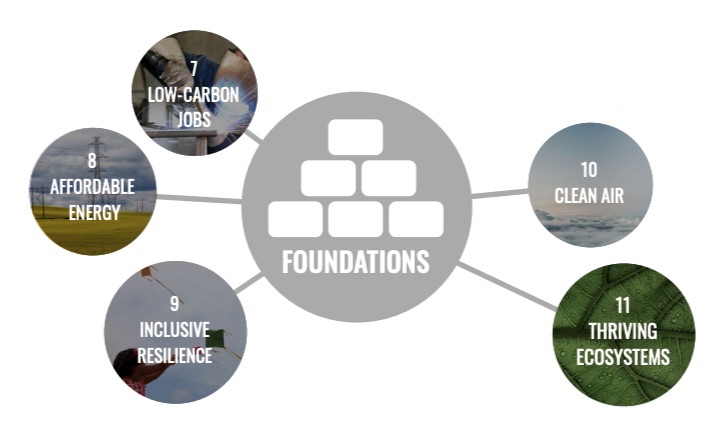
Click on figure to see the 11 indicators
Connecting the dots
At a national level, Canada is making good progress on some of these indicators. But as we zoom in at the regional and local level, it’s clear we have more work to do. Here’s a sample of what we found:
Indicator 7: Low-carbon jobs.
A clean growth transition can only be successful if the Canadian economy provides quality jobs to Canadians across the country. We find that while national and provincial job growth is promising, the challenges are at the sectoral, regional, and individual level. Many small and rural communities in Canada, for example, rely on a single sector for the bulk of their employment opportunities. Yet these sectors could be substantially disrupted as the world pivots to reduce GHG emissions (see figure 1). Targeted policies to help workers develop skills and training needed to succeed in a low-carbon economy will be critical.
Figure 1: Concentration of Employment by Sector and Economic Region, 2016

Click on figure for higher resolution
Indicator 8: Affordable energy.
Policies that help reduce our GHG emissions shouldn’t make energy unaffordable, particularly for those with lower incomes. And while households spent less on energy in 2018 than they did in 2010 (see figure 2), low-income households in Atlantic Canada, for example, still spend more than 10% of their budget on energy. One solution (of many) is to scale up energy efficiency—such as the Mi’kmaq Energy Efficiency Program in Nova Scotia—which can go a long way to making energy more affordable for those in need.
Figure 2: Total energy expenditures as share of total current expenditures (household heating and electricity costs, vehicle fuel costs, and transit costs)

Click on figure for higher resolution
Indicator 9: Inclusive Resilience.
Poverty rates are a key indicator of climate resilience. Those that cannot afford to prepare, move, rebuild, or recover from extreme climate events are typically more vulnerable. Poverty is also highly correlated with other key factors that shape vulnerability, such as inadequate access to housing, clean drinking water, education, health care, and other factors such as discrimination and colonization.
While poverty rates steadily decreased in Canada between 2006 and 2018, they remain high for select groups, suggesting that some Canadians remain highly sensitive and poorly equipped to deal with climate impacts (see figure 3). What’s more, many low-income communities in Canada are located in areas that are more exposed to extreme climate events, like flooding and heatwaves. Mapping these vulnerabilities onto climate risk data—like the City of Montreal—is one way to better understand these connections.
Figure 3: Market-based poverty rates across select categories

Click on figure for higher resolution
Indicator 10 : Clean Air.
Improving and protecting human health is a key part of a clean growth transition. In many cases, air pollutants and GHG emissions are emitted at the same time from the same sources. As a result, Canada has significant opportunities to improve health outcomes as it accelerates action to reduce GHG emissions. And while Canadians generally enjoy good air quality relative to other countries, levels of some pollutants approach or exceed national air quality guidelines (see figure 4). Air quality is particularly bad in low-income, marginalized, and racialized communities that are often located closer to the source of emissions.
Figure 4: Ambient Air Quality, Annual Average Concentrations, Select Cities

Click on figure for higher resolution
Strength in diversity
Although climate policy cannot singlehandedly address the complex and deep-rooted socio-economic problems in Canada, it can clearly play a more constructive role. As these four indicator categories demonstrate, there are big opportunities for addressing climate issues and social inequities in parallel.
Yet we are also in the early stages of understanding these important relationships. Due to a lack of intersectional data in Canada, the indicators listed here (and in our report) are imperfect. The first step is improving how we collect data. For this, our report lays out concrete recommendations.
Ultimately, Canadian governments and researchers (like ourselves) need to do a better job at integrating social inequities into how policy is designed and implemented, which includes seriously confronting the root causes of inequities in Canadian society.