Data visualizations
See our summary report for context. All text and graphs are Creative Commons licensed and free to use with attribution.
Province- and territory-level breakouts are also available.
Figure A.
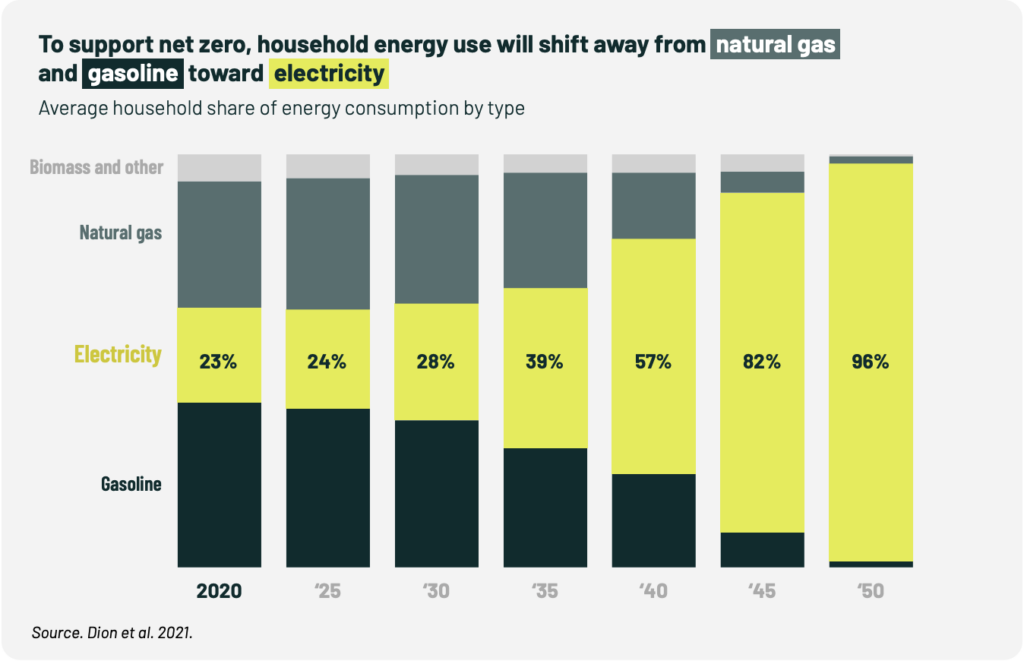
![](https://climateinstitute.ca/wp-content/uploads/2022/05/household-energy-use-1024x661.png)
Source: Dion et al. 2021.
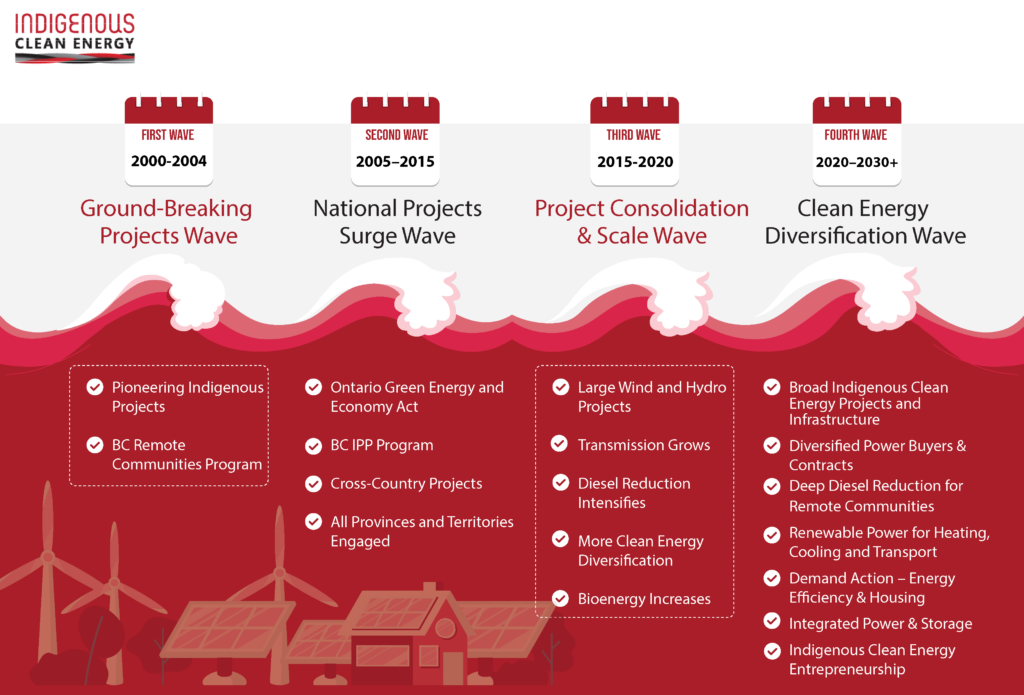
Figure B.
![The Waves of Indigenous Clean Energy Participation](https://climateinstitute.ca/wp-content/uploads/2022/04/The-Waver-of-Indigenous-Clean-Energy-Participation-01-1024x695.png)
Source: ICE 2022.
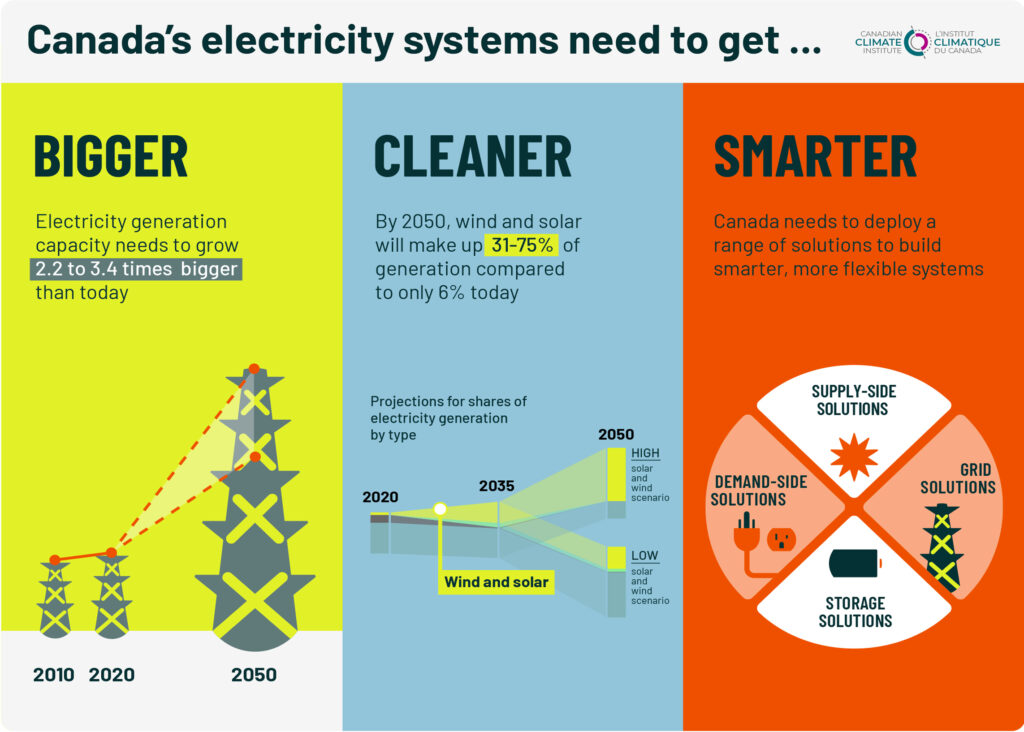
Figure C.
![Canada's electric systems need to get bigger, cleaner, smarter](https://climateinstitute.ca/wp-content/uploads/2022/04/bigger-cleaner-smarter-1024x732.jpg)
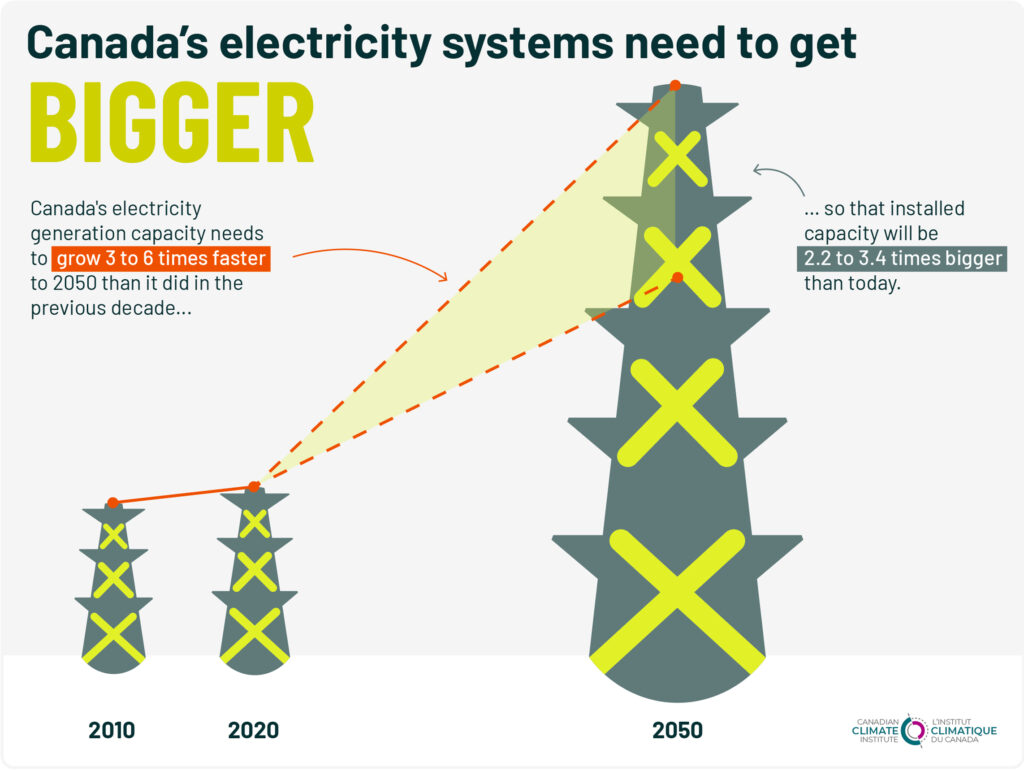
Figure D.
![Canada's electric systems need to get bigger](https://climateinstitute.ca/wp-content/uploads/2022/04/bigger-1024x771.jpg)
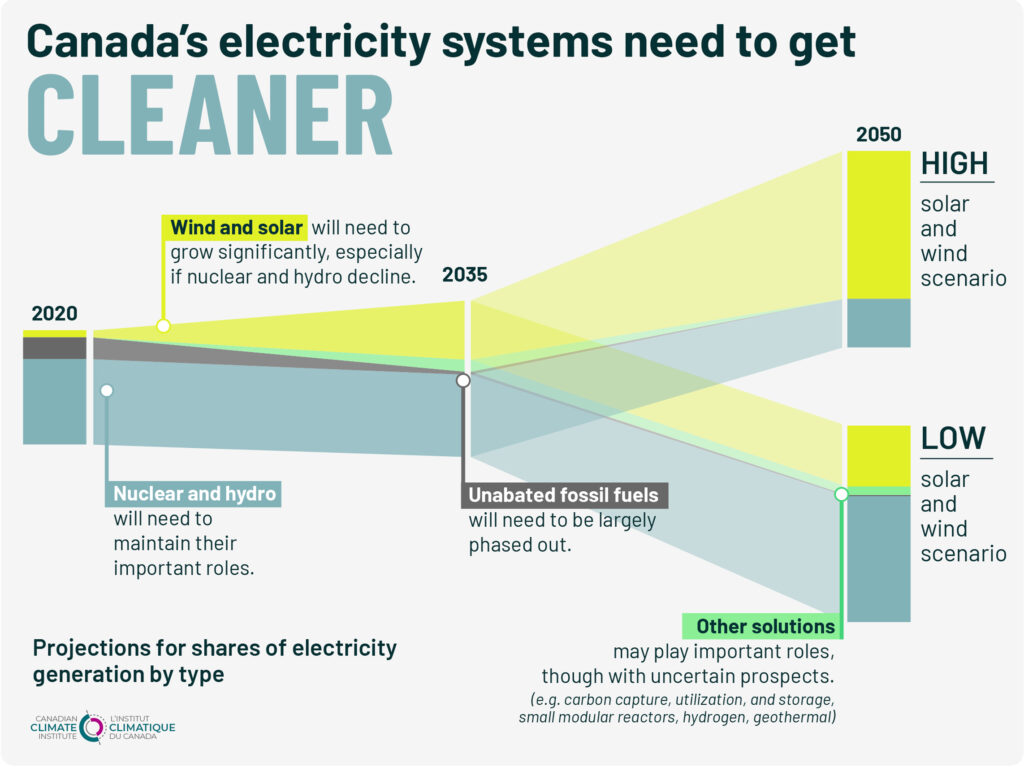
Figure E.
![Canada's electric systems need to get cleaner](https://climateinstitute.ca/wp-content/uploads/2022/04/cleaner-1024x767.jpg)
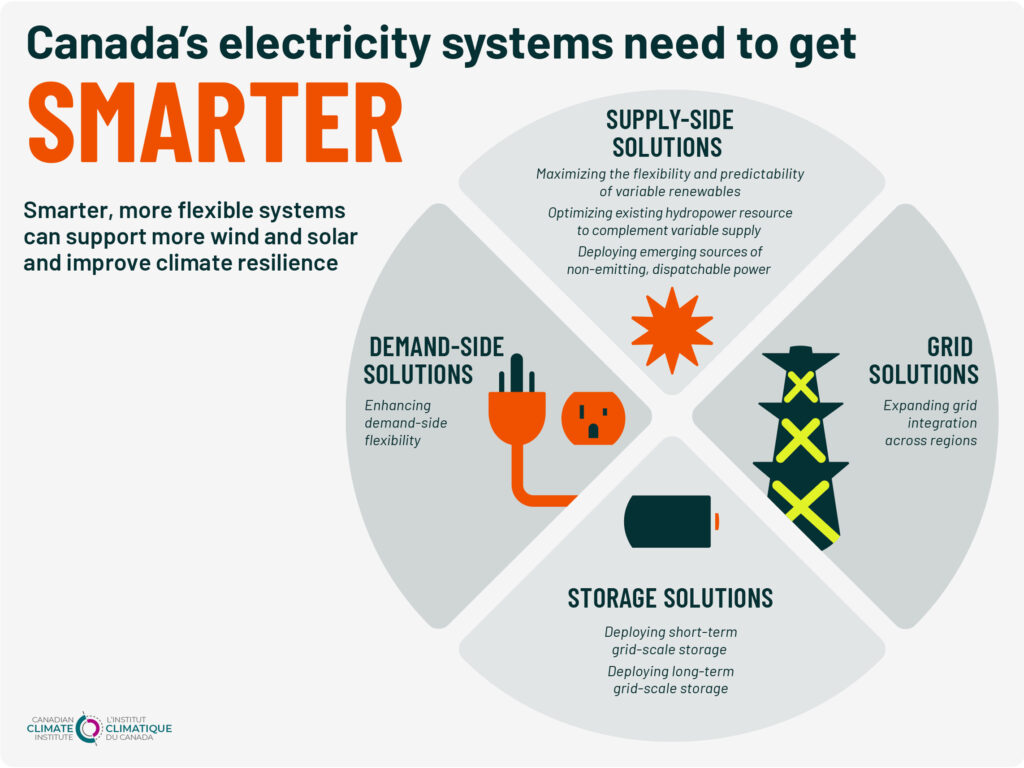
Figure F.
![Canada's electric systems need to get smarter](https://climateinstitute.ca/wp-content/uploads/2022/04/smarter-1024x768.jpg)
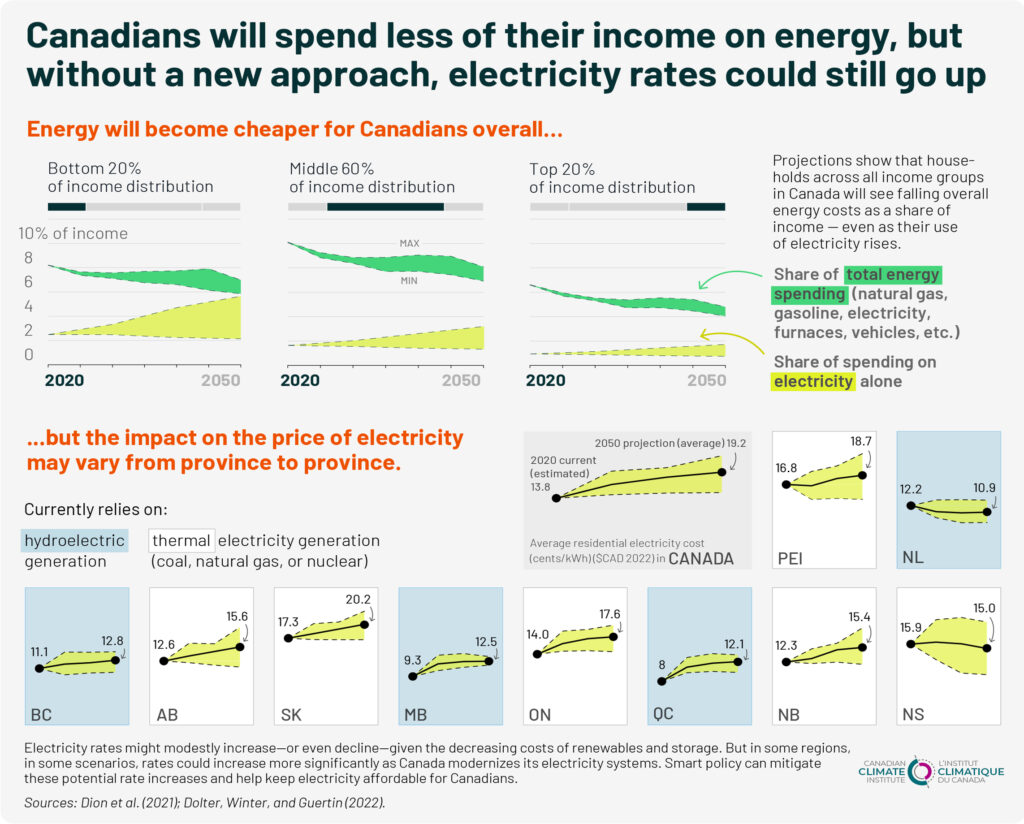
Figure G.
![Canadian will spend less of their income on energy](https://climateinstitute.ca/wp-content/uploads/2022/04/electricity-rates-1024x824.jpg)
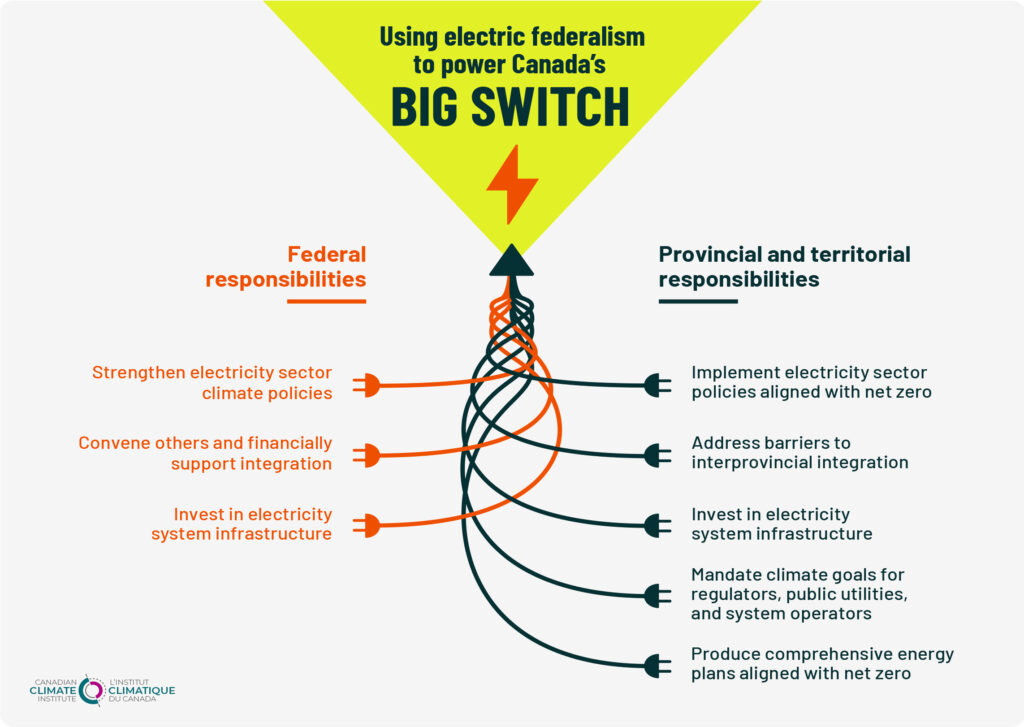
Figure H.
![Using electric federalism to power Canada's big switch](https://climateinstitute.ca/wp-content/uploads/2022/04/electric-federalism-1024x727.jpg)