Resources
Presentation
The research team go through the main findings and recommandations of Due North:
Access the briefing deck here.
Infographics
All Due North text and graphs are Creative Commons licensed and free to use with attribution.
Figure 1
Figure 3
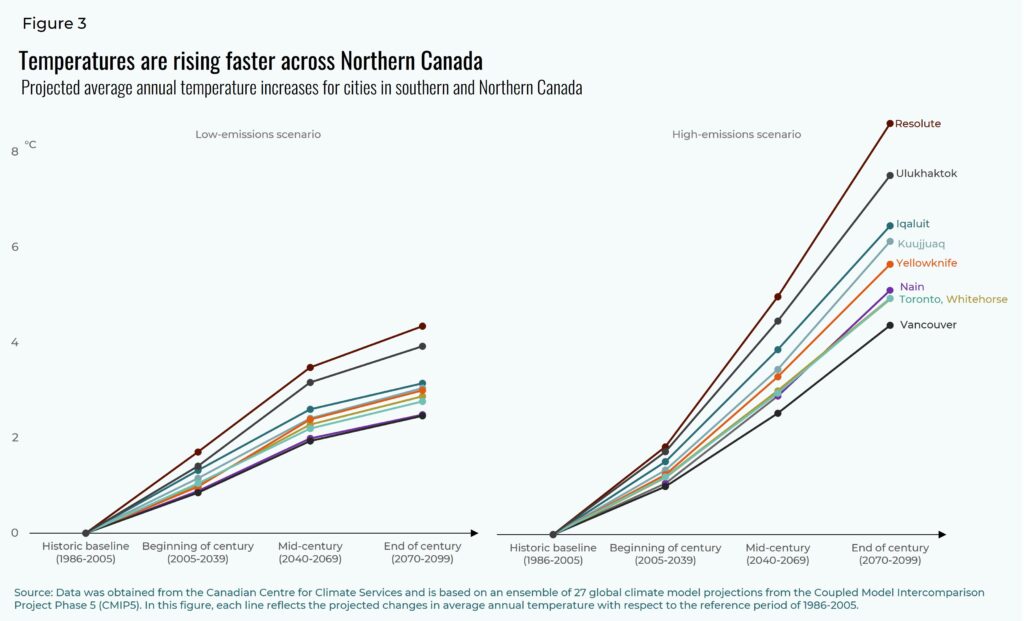
Figure 5
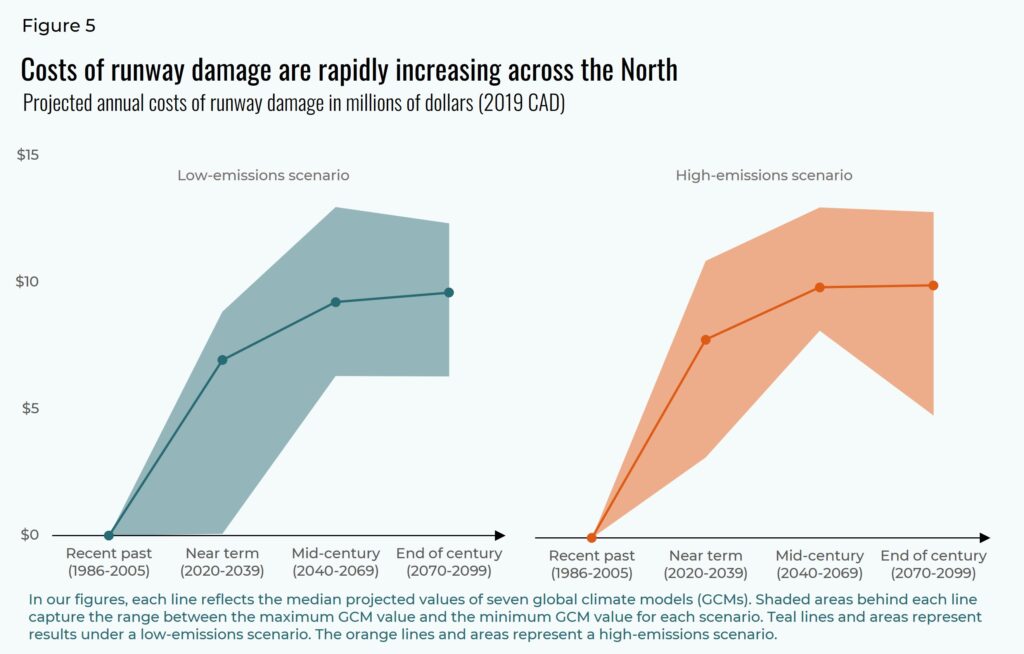
Figure 6
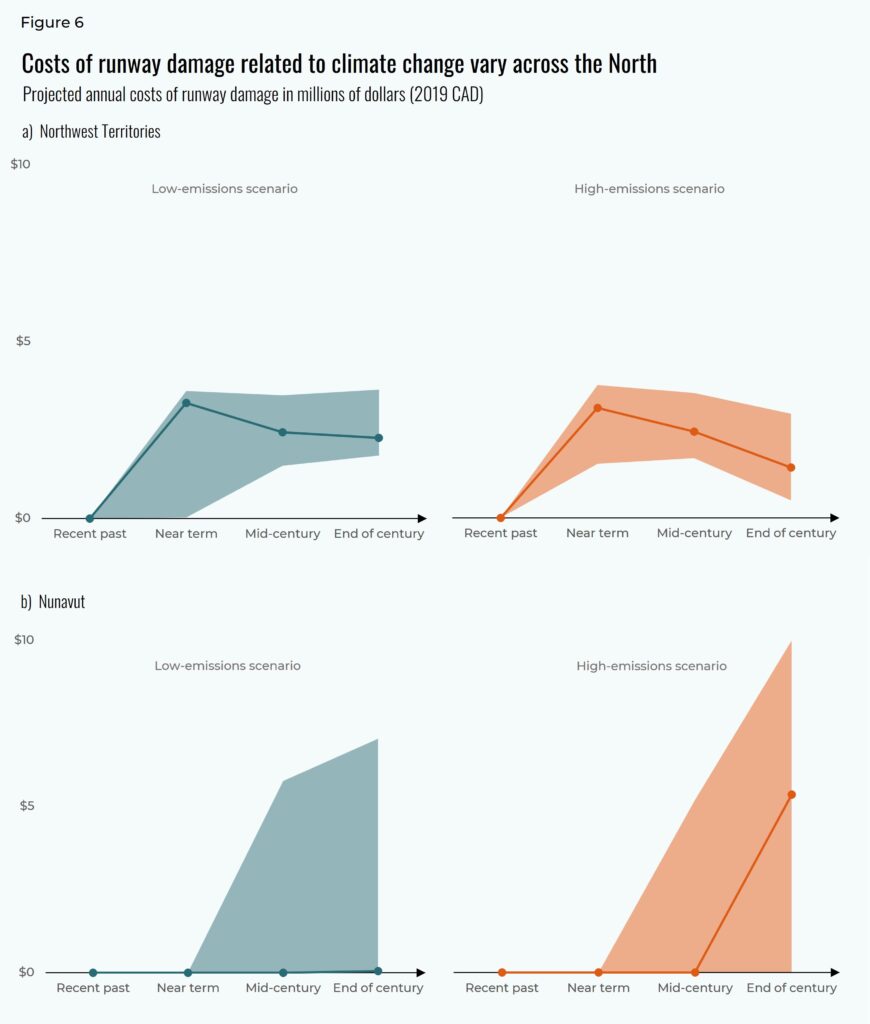
Figure 7
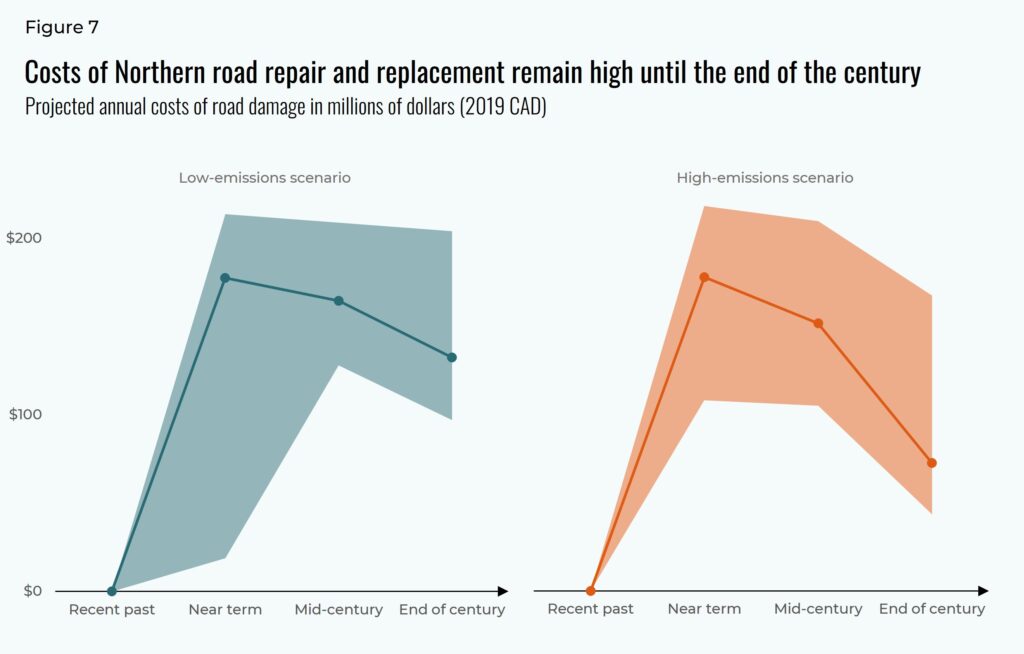
Figure 8
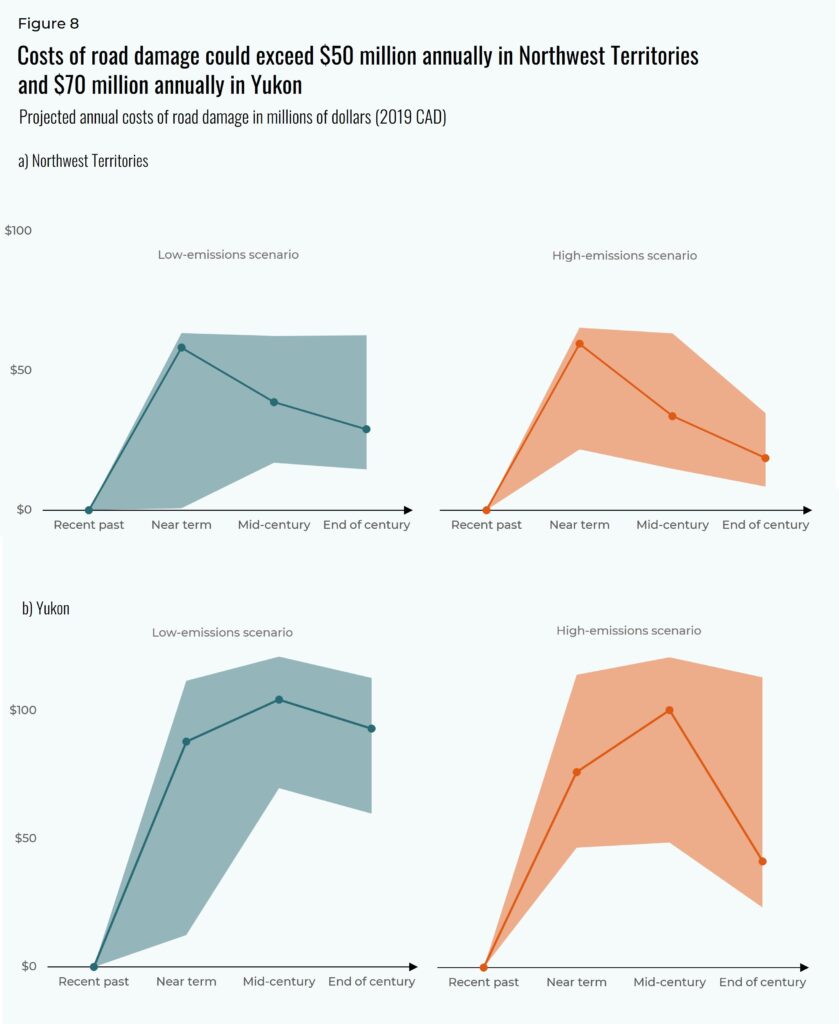
Figure 9
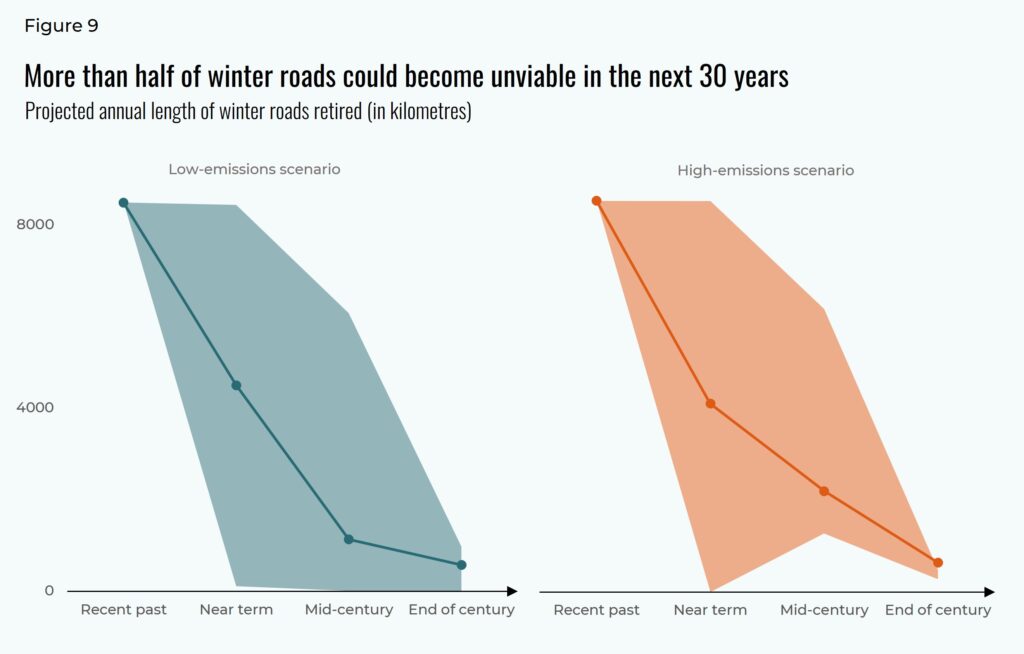
Figure 10
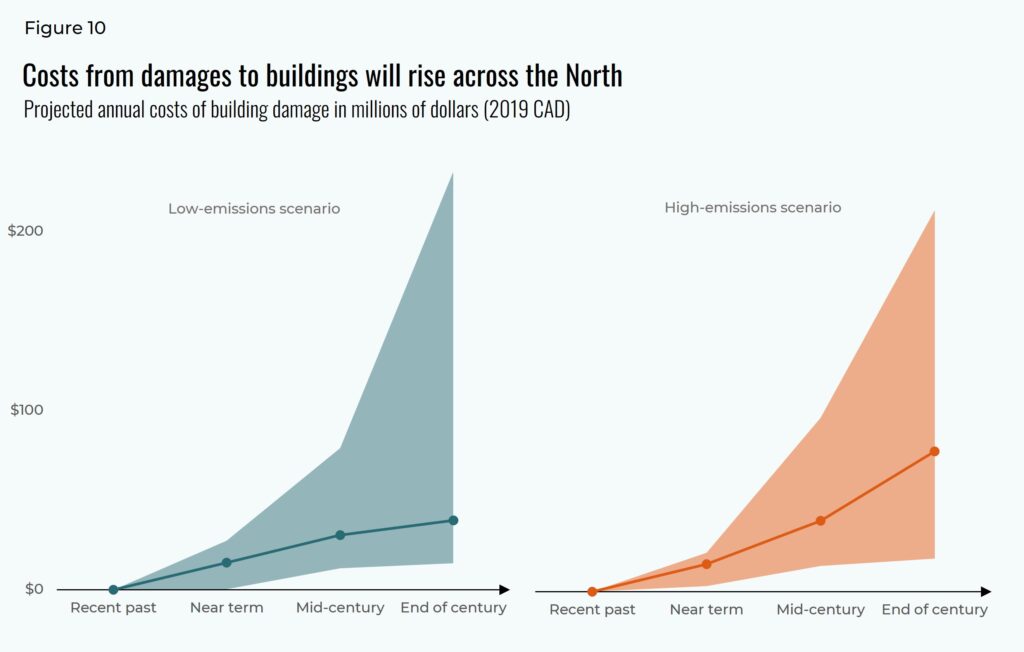
Figure 11
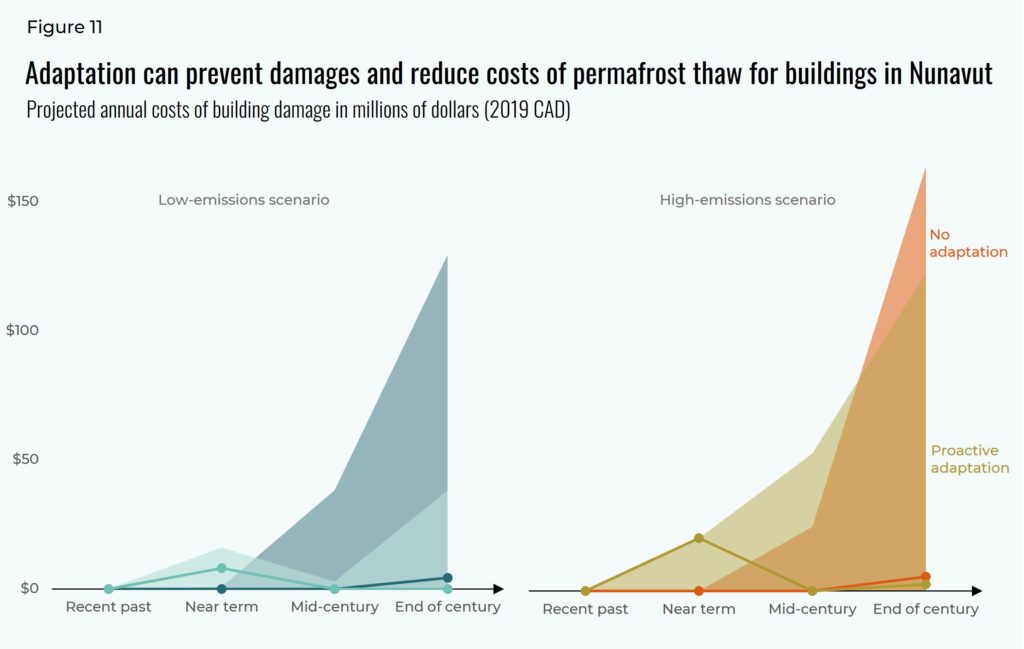
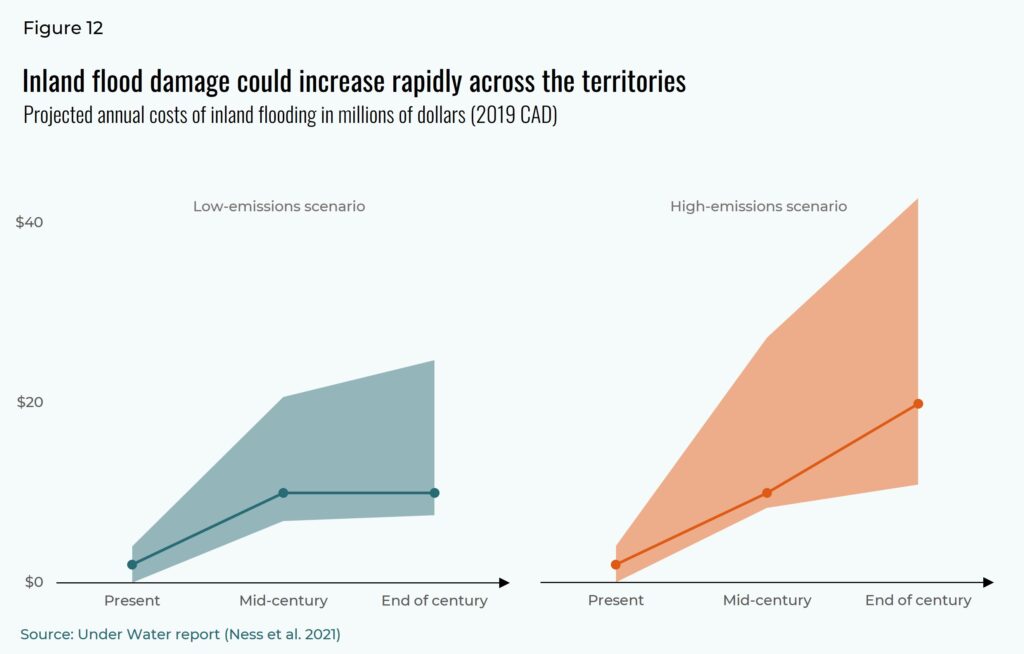
figure 12